Measure delivery reliability and stability
Measuring delivery reliability and stability provides visibility into how consistently software changes move from commit to production, and where breakdowns disrupt engineering flow. By making failures, delays, and recovery patterns observable, teams can distinguish isolated issues from systemic instability that affects delivery outcomes.
Without this visibility, workflow failures and CI/CD friction are treated as one-off incidents rather than recurring signals, making it difficult to prioritize improvements, reduce delivery risk, and sustain predictable throughput as the organization scales.
This guide helps engineering managers, platform engineers, and product leaders answer questions such as:
- Workflow failures: How often do CI/CD workflows fail, and where do failures concentrate?
- Bottlenecks: Which workflows or services have the highest failure rates?
- Impact on delivery: How frequently do failing workflows block pull requests and slow down delivery?
By the end of this guide, you'll have a working dashboard that tracks key reliability and stability metrics, enabling you to identify unstable workflows, measure the impact of failures on delivery, and prioritize improvements to your CI/CD infrastructure.
Common use cases
- Track workflow failure rates to identify unstable CI/CD pipelines.
- Monitor PRs blocked by failing CI/CD to understand delivery bottlenecks.
- Identify services and workflows with the highest failure rates.
- Understand where instability concentrates across services and teams.
Prerequisites
This guide assumes the following:
- You have a Port account and have completed the onboarding process.
- Port's GitHub integration is installed in your account.
- The
githubPullRequestandgithubRepositoryblueprints are already created (these are created when you install the GitHub integration).
This guide focuses on measuring reliability and stability using source control management (SCM) data, including repositories, pull requests, and workflows. This is the first iteration of reliability and stability measurement and will expand in future versions to include additional metrics and data sources such as monitoring tools, and other operational signals.
Key metrics overview
We will track three key metrics to measure reliability and stability:
| Metric | What it measures | Why it matters |
|---|---|---|
| Workflow failure rate | How often CI/CD workflows fail and where failures occur | Identifies unstable workflows and services that need attention, helping prioritize infrastructure improvements |
| PRs blocked by failing CI/CD | Number of pull requests blocked by failed workflow runs | Shows the direct impact of CI/CD failures on delivery velocity and helps quantify the cost of instability |
| CI/CD failure concentration | Distribution of CI/CD failures across workflows, services, or repos | Helps to identify recurring failure patterns and prioritise the most important issues to fix |
Set up data model
We will create blueprints to model your GitHub workflow data. The githubPullRequest and githubRepository blueprints should already exist from the GitHub integration installation.
Create the GitHub workflow blueprint
-
Go to the Builder page of your portal.
-
Click on
+ Blueprint. -
Click on the
{...}button in the top right corner, and chooseEdit JSON. -
Add this JSON schema:
GitHub workflow blueprint (Click to expand)
{
  "identifier": "githubWorkflow",
  "title": "Workflow",
  "icon": "Github",
  "schema": {
    "properties": {
      "path": {
        "title": "Path",
        "type": "string"
      },
      "status": {
        "title": "Status",
        "type": "string",
        "enum": [
          "active",
          "deleted",
          "disabled_fork",
          "disabled_inactivity",
          "disabled_manually"
        ],
        "enumColors": {
          "active": "green",
          "deleted": "red"
        }
      },
      "createdAt": {
        "title": "Created At",
        "type": "string",
        "format": "date-time"
      },
      "updatedAt": {
        "title": "Updated At",
        "type": "string",
        "format": "date-time"
      },
      "deletedAt": {
        "title": "Deleted At",
        "type": "string",
        "format": "date-time"
      },
      "link": {
        "title": "Link",
        "type": "string",
        "format": "url"
      }
    },
    "required": []
  },
  "mirrorProperties": {},
  "calculationProperties": {},
  "aggregationProperties": {},
  "relations": {
    "repository": {
      "title": "Repository",
      "target": "githubRepository",
      "required": false,
      "many": false
    }
  }
} -
Click
Saveto create the blueprint.
Create the GitHub workflow run blueprint
-
Go to the Builder page of your portal.
-
Click on
+ Blueprint. -
Click on the
{...}button in the top right corner, and chooseEdit JSON. -
Add this JSON schema:
GitHub workflow run blueprint (Click to expand)
{
  "identifier": "githubWorkflowRun",
  "title": "Workflow Run",
  "icon": "Github",
  "schema": {
    "properties": {
      "name": {
        "title": "Name",
        "type": "string"
      },
      "triggeringActor": {
        "title": "Triggering Actor",
        "type": "string"
      },
      "status": {
        "title": "Status",
        "type": "string",
        "enum": [
          "completed",
          "action_required",
          "cancelled",
          "startup_failure",
          "failure",
          "neutral",
          "skipped",
          "stale",
          "success",
          "timed_out",
          "in_progress",
          "queued",
          "requested",
          "waiting"
        ],
        "enumColors": {
          "queued": "yellow",
          "in_progress": "yellow",
          "success": "green",
          "failure": "red"
        }
      },
      "conclusion": {
        "title": "Conclusion",
        "type": "string",
        "enum": [
          "completed",
          "action_required",
          "cancelled",
          "startup_failure",
          "failure",
          "neutral",
          "skipped",
          "stale",
          "success",
          "timed_out",
          "in_progress",
          "queued",
          "requested",
          "waiting"
        ],
        "enumColors": {
          "queued": "yellow",
          "in_progress": "yellow",
          "success": "green",
          "failure": "red"
        }
      },
      "createdAt": {
        "title": "Created At",
        "type": "string",
        "format": "date-time"
      },
      "runStartedAt": {
        "title": "Run Started At",
        "type": "string",
        "format": "date-time"
      },
      "updatedAt": {
        "title": "Updated At",
        "type": "string",
        "format": "date-time"
      },
      "runNumber": {
        "title": "Run Number",
        "type": "number"
      },
      "runAttempt": {
        "title": "Run Attempts",
        "type": "number"
      },
      "link": {
        "title": "Link",
        "type": "string",
        "format": "url"
      },
      "headBranch": {
        "title": "Head Branch",
        "description": "The branch that triggered the workflow run",
        "type": "string"
      }
    },
    "required": []
  },
  "mirrorProperties": {
    "repository": {
      "title": "Repository",
      "path": "workflow.repository.$title"
    }
  },
  "calculationProperties": {},
  "aggregationProperties": {},
  "relations": {
    "pullRequests": {
      "title": "Pull Requests",
      "target": "githubPullRequest",
      "required": false,
      "many": true
    },
    "workflow": {
      "target": "githubWorkflow",
      "required": true,
      "many": false
    }
  }
} -
Click
Saveto create the blueprint.
Update integration mapping
Now we'll configure the GitHub integration to ingest workflow and workflow run data into your catalog. If you already have existing mappings for repositories and pull requests, make sure to include the workflow and workflow-run kinds.
For the workflow run to pull request relation to work correctly, ensure your githubPullRequest blueprint has a branch property. If it doesn't exist, add it to the blueprint schema as a string property. The mapping below includes the branch property in the pull request mapping.
-
Go to your Data Source page.
-
Select the GitHub integration.
-
Add or update the following YAML block in the editor to ingest data from GitHub:
GitHub integration configuration (Click to expand)
resources:
  - kind: repository
    selector:
      query: 'true'
      teams: true
    port:
      entity:
        mappings:
          identifier: .full_name
          title: .name
          blueprint: '"githubRepository"'
          properties:
            readme: file://README.md
            url: .html_url
            defaultBranch: .default_branch
            last_push: .pushed_at
  - kind: pull-request
    selector:
      query: 'true'
      closedPullRequests: false
    port:
      entity:
        mappings:
          identifier: .id|tostring
          title: .title
          blueprint: '"githubPullRequest"'
          properties:
            status: .status
            closedAt: .closed_at
            updatedAt: .updated_at
            mergedAt: .merged_at
            createdAt: .created_at
            link: .html_url
            branch: .head.ref
            leadTimeHours: >-
              (.created_at as $createdAt | .merged_at as $mergedAt | ($createdAt
              | sub("\\..*Z$"; "Z") | strptime("%Y-%m-%dT%H:%M:%SZ") | mktime)
              as $createdTimestamp | ($mergedAt | if . == null then null else
              sub("\\..*Z$"; "Z") | strptime("%Y-%m-%dT%H:%M:%SZ") | mktime end)
              as $mergedTimestamp | if $mergedTimestamp == null then null else
              (((($mergedTimestamp - $createdTimestamp) / 3600) * 100 | floor) /
              100) end)
            pr_age: >-
              ((now - (.created_at | sub("\\.[0-9]+Z$"; "Z") | fromdateiso8601))
              / 86400) | round
            pr_age_label: >-
              ((now - (.created_at | sub("\\.[0-9]+Z$"; "Z") | fromdateiso8601))
              / 86400 | round) as $age | if $age <= 3 then "0-3 days" elif $age
              <= 7 then "3-7 days" else ">7 days" end
            cycle_time: >-
              if .merged_at then (((.merged_at   | sub("\\.[0-9]+Z$"; "Z") |
              fromdateiso8601) - (.created_at | sub("\\.[0-9]+Z$"; "Z") |
              fromdateiso8601)) / 86400 | round) else null end
          relations:
            repository: .head.repo.full_name
  - kind: workflow
    selector:
      query: 'true'
    port:
      entity:
        mappings:
          identifier: >-
            (.url | capture("repos/(?<repo>[^/]+/[^/]+)/") | .repo) +
            (.id|tostring)
          title: .name
          blueprint: '"githubWorkflow"'
          properties:
            path: .path
            status: .state
            createdAt: .created_at
            updatedAt: .updated_at
            link: .html_url
          relations:
            repository: (.url | capture("repos/(?<repo>[^/]+/[^/]+)/") | .repo)
  - kind: workflow-run
    selector:
      query: 'true'
    port:
      entity:
        mappings:
          identifier: .repository.full_name + (.id|tostring)
          title: .display_title
          blueprint: '"githubWorkflowRun"'
          properties:
            name: .name
            triggeringActor: .triggering_actor.login
            status: .status
            conclusion: .conclusion
            createdAt: .created_at
            runStartedAt: .run_started_at
            updatedAt: .updated_at
            runNumber: .run_number
            runAttempt: .run_attempt
            link: .html_url
            headBranch: .head_branch
          relations:
            workflow: .repository.full_name + (.workflow_id|tostring)
            pullRequests: if (.pull_requests | length) > 0 then (.pull_requests | map(.id)) else null end
If you already have mappings for repositories and pull requests, make sure to add the workflow and workflow-run kinds to your existing configuration. The mapping above includes all required kinds for this guide.
- Click
Save & Resyncto apply the mapping.
Visualize metrics
Once the GitHub data is synced, we can create a dedicated dashboard in Port to monitor and analyze reliability and stability metrics using customizable widgets.
Create a dashboard
- Navigate to your software catalog.
- Click on the
+ Newbutton in the left sidebar. - Select New dashboard.
- Name the dashboard Reliability.
- Click
Create.
We now have a blank dashboard where we can start adding widgets to visualize reliability and stability metrics.
Add widgets
In the new dashboard, create the following widgets:
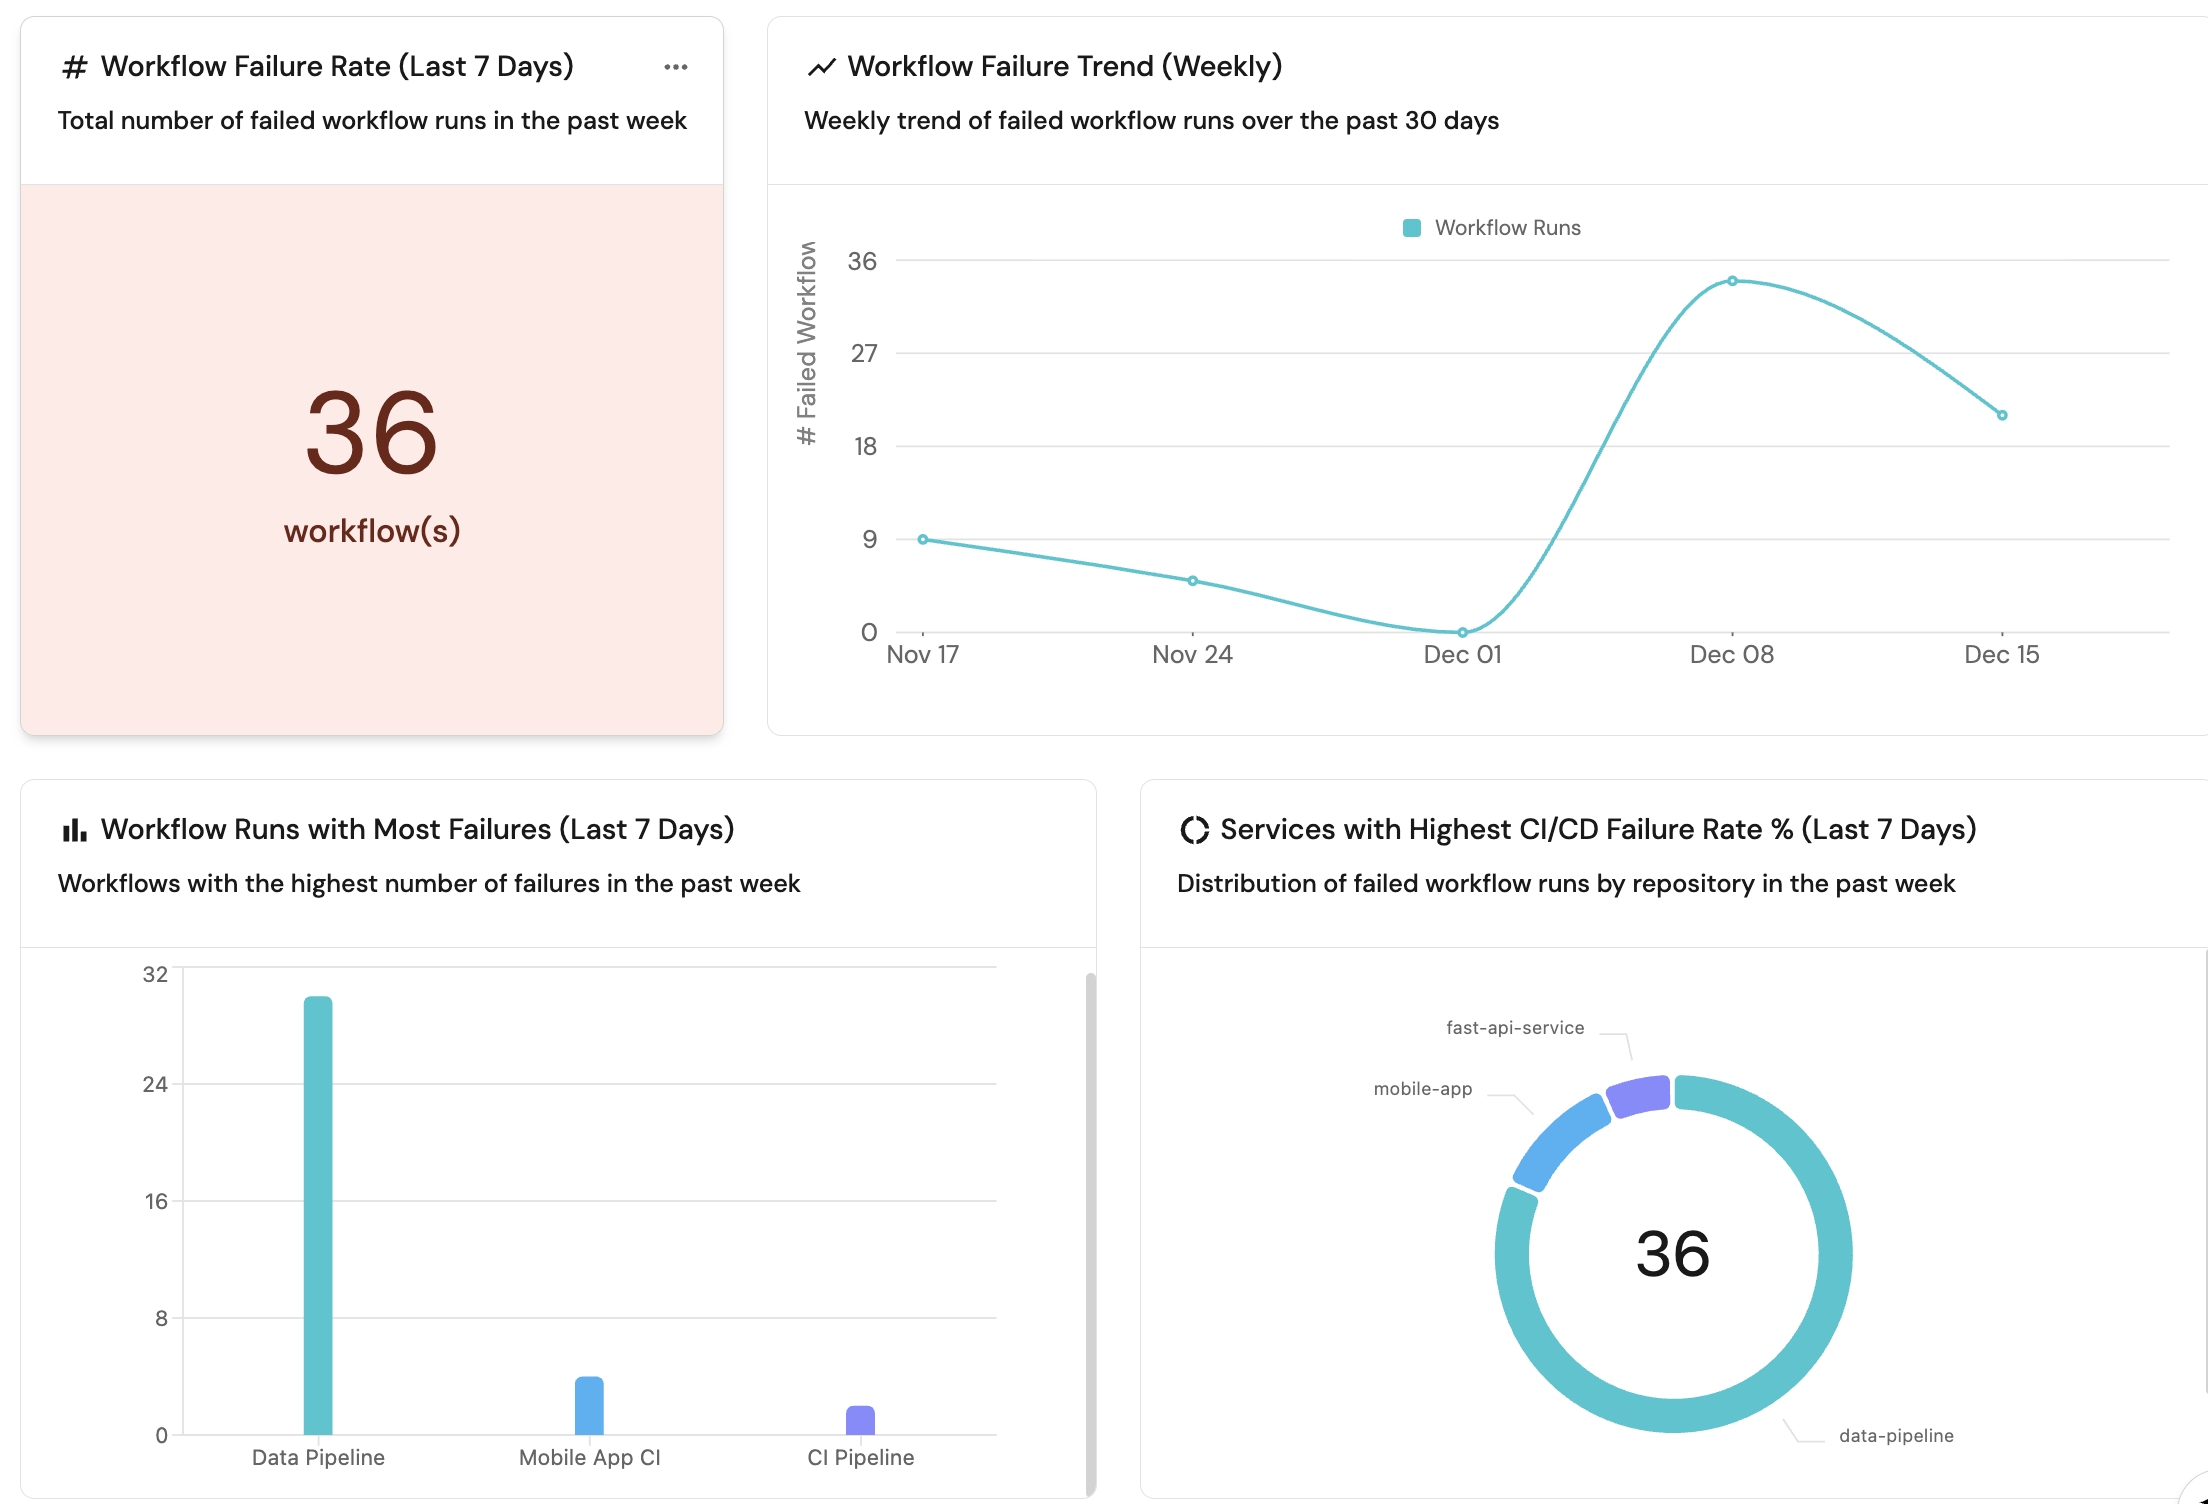
Workflow failure rate (last 7 days) (click to expand)
-
Click
+ Widgetand select Number Chart. -
Title:
Workflow Failure Rate (Last 7 Days). -
Description:
Total number of failed workflow runs in the past week. -
Select
Count entitiesChart type and choose Workflow Run as the Blueprint. -
Select
countfor the Function. -
Add this JSON to the Dataset filter editor:
{
  "combinator": "and",
  "rules": [
    {
      "value": "failure",
      "property": "conclusion",
      "operator": "="
    },
    {
      "property": "runStartedAt",
      "operator": "between",
      "value": {
        "preset": "lastWeek"
      }
    }
  ]
} -
Select
customas the Unit and inputworkflow(s)as the Custom unit. -
Click
Save.
Workflow failure trend (weekly) (click to expand)
-
Click
+ Widgetand select Line Chart. -
Title:
Workflow Failure Trend (Weekly). -
Description:
Weekly trend of failed workflow runs over the past 30 days. -
Select
Count Entities (All Entities)Chart type and choose Workflow Run as the Blueprint. -
Input
# Failed Workflowsas the Y axis Title. -
Select
countfor the Function. -
Add this JSON to the Additional filters editor:
{
  "combinator": "and",
  "rules": [
    {
      "value": "failure",
      "property": "conclusion",
      "operator": "="
    }
  ]
} -
Input
Dateas the X axis Title. -
Select
runStartedAtfor Measure time by. -
Set Time Interval to
weekand Time Range toIn the past 30 days. -
Click
Save.
Workflow runs with most failures (last 7 days) (click to expand)
-
Click
+ Widgetand select Bar Chart. -
Title:
Workflow Runs with Most Failures (Last 7 Days). -
Description:
Workflows with the highest number of failures in the past week. -
Choose the Workflow Run blueprint.
-
Under
Breakdown by property, select the Name property. -
Add this JSON to the Additional filters editor:
{
  "combinator": "and",
  "rules": [
    {
      "value": "failure",
      "property": "conclusion",
      "operator": "="
    },
    {
      "property": "runStartedAt",
      "operator": "between",
      "value": {
        "preset": "lastWeek"
      }
    }
  ]
} -
Click
Save.
Services with highest CI/CD failure rate % (last 7 days) (click to expand)
-
Click
+ Widgetand select Pie chart. -
Title:
Services with Highest CI/CD Failure Rate % (Last 7 Days). -
Description:
Distribution of failed workflow runs by repository in the past week. -
Choose the Workflow Run blueprint.
-
Under
Breakdown by property, select the Repository property (this is a mirror property from the workflow relation). -
Add this JSON to the Additional filters editor:
{
  "combinator": "and",
  "rules": [
    {
      "value": "failure",
      "property": "conclusion",
      "operator": "="
    },
    {
      "property": "runStartedAt",
      "operator": "between",
      "value": {
        "preset": "lastWeek"
      }
    }
  ]
} -
Click Save.
Number of PRs blocked by failing CI/CD (click to expand)
-
Click
+ Widgetand select Number Chart. -
Title:
PRs Blocked by Failing CI/CD. -
Select
Count entitiesChart type and choose Pull Request as the Blueprint. -
Select
countfor the Function. -
Add this JSON to the Dataset filter editor:
{
  "combinator": "and",
  "rules": [
    {
      "value": 1,
      "property": "failedWorkflowsCount",
      "operator": ">="
    },
    {
      "value": "open",
      "property": "status",
      "operator": "="
    }
  ]
} -
Select
customas the Unit and inputprsas the Custom unit. -
Click
Save.
PRs blocked by failing CI/CD table (click to expand)
-
Click
+ Widgetand select Table. -
Title the widget PRs Blocked by Failing CI/CD.
-
Choose the Pull Request blueprint.
-
Add this JSON to the Initial filters editor:
{
  "combinator": "and",
  "rules": [
    {
      "value": 1,
      "property": "failedWorkflowsCount",
      "operator": ">="
    },
    {
      "value": "open",
      "property": "status",
      "operator": "="
    }
  ]
} -
Click Save to add the widget to the dashboard.
-
Click on the
...button in the top right corner of the table and select Customize table. -
In the top right corner of the table, click on
Manage Propertiesand add the following properties:- Title: The title of the pull request.
- Link: The URL to the pull request.
- Repository: The related repository.
- PR Age: The age of the pull request.
-
Click on the save icon in the top right corner of the widget to save the customized table.